Muaaz Bin Sarfaraz · Analytics Portfolio

Turning data into decisions leaders can fund.

A collection of projects I built to sharpen my analytical skills and explore business problems. It includes independent work with publicly available data and case presentations prepared for interviews over the years, spanning travel, marketplaces, public-sector payments, banking, and retail.

Six cases, one pattern: size it, prove it, operationalise it

01 / Case studies at a glance
HeadlineAnalysis / proposed valueSetting
7-figureModelled annual revenue upside from fixing a checkout currency mismatch, packaged as an experiment-ready product caseOnline travel agency · side projectCase A →
€180kModelled extra GMV a year, per city, from closing peak-hour supply gaps; plus an ROI-ranked incentive allocation model and global operating modelRide-hailing marketplace, 45 countries / 500 cities · side projectCase B →
4,000Physicians in a new payment model, with a weighted KPI scorecard and matched-cohort evaluation plan to decide whether to scaleProvincial physician payments · side projectCase C →
95%Case-study matching benchmark of 95%, with a modelled opportunity to retain data control and save 36,000+ work hours a yearRetail bank, digital onboarding · side projectCase D →
2h → 10mPackaging data QA per product, across 2,000+ new consumer goods a yearGlobal grocery retailer · side projectCase E →
2 marketsPrioritised for e-commerce expansion (UK, France), with a physical-retail partnership and demand-generation planRare-spirits e-commerce · side projectCase F →

These are independent learning projects and interview case exercises, using publicly available data or problems provided during interviews. None represents work carried out as an employee of any company. Company names provide case context only and do not imply employment, a client engagement or endorsement.

Case A · Payments & pricing strategy02 / Online travel agency
Online Travel AgencySide projectBusiness case to Product

The price looked local. The card charge did not.

The site showed shoppers prices in their own currency, but most cards were charged in a single foreign currency. Could that cost bookings, and was it worth a product team's quarter to fix?

~85%of all paid transactions were settled in one foreign currency, 96 to 98% in the two priority source markets
4.6×the payment-cancellation rate of home-currency payers in the worst affected priority market (1.9× in the second)
7-figbase-case annual net-revenue upside across markets, with low and high scenarios; GMV impact roughly 3.5× that

Diagnosis

  • Examined charged versus displayed currency in the public-data checkout case study
  • Used home-currency payers as the clean benchmark for payment failure
  • Compared failure rates by payer market to isolate the effect of a foreign-currency charge

Model

  • One uniform, defensible uplift rule per market: close the failure gap to the benchmark
  • Applied to annualised, bot-filtered net revenue by currency
  • Scenarios for recovering one-third, half and all of the gap

Decision package

  • Structured as a proposed product brief: background, hypothesis, scope in and out, acceptance criteria, experiment metrics, risks
  • Excluded markets where the change would not apply, to keep the number credible

Leadership signal

Identified a potential revenue leak, modelled an auditable business case and designed an experiment that a product team could evaluate.

Cancellation rates are shown as multiples of the home-currency benchmark.

Independent learning / interview case exercise. Based on publicly available data or an interview problem. Not professional work performed as an employee of any company. Figures and recommendations describe this exercise, not an employer implementation.

Case B · Growth analytics & operating model03 / Ride-hailing marketplace
Two-sided marketplaceSide project€500M incentive budget

Where to spend €500M of incentives across 45 countries

Riders were opening the app and seeing no cars at peak hours. How much supply is missing, what should a driver be guaranteed to fill it, and how should a global incentive budget be allocated and governed?
<60%coverage in the 7 to 11 AM peak, against an 80%+ standard; midday driver utilisation halves
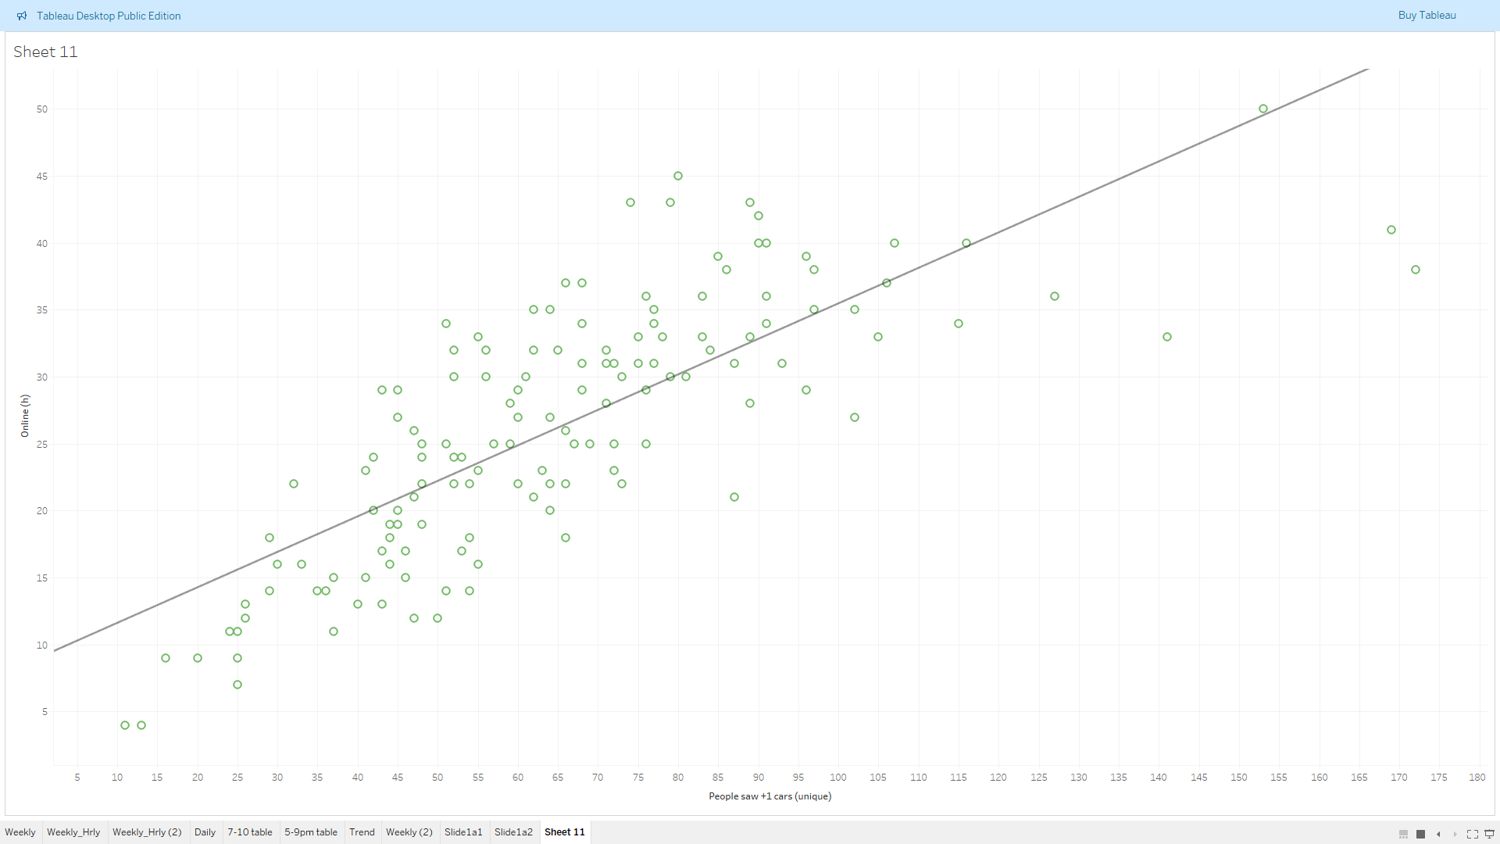
0.27hextra online driver hours per missed rider (linear model, R² ≈ 0.6, p < 0.05)
+€180kmodelled GMV a year per city (illustrative annual scenario), with €19 / €24 guaranteed earnings per peak shift
Scatter plot of driver online hours against riders who found a car, with a fitted regression line
Online hours needed to meet demand: Online(h) = 0.27 × (riders served) + 8.97
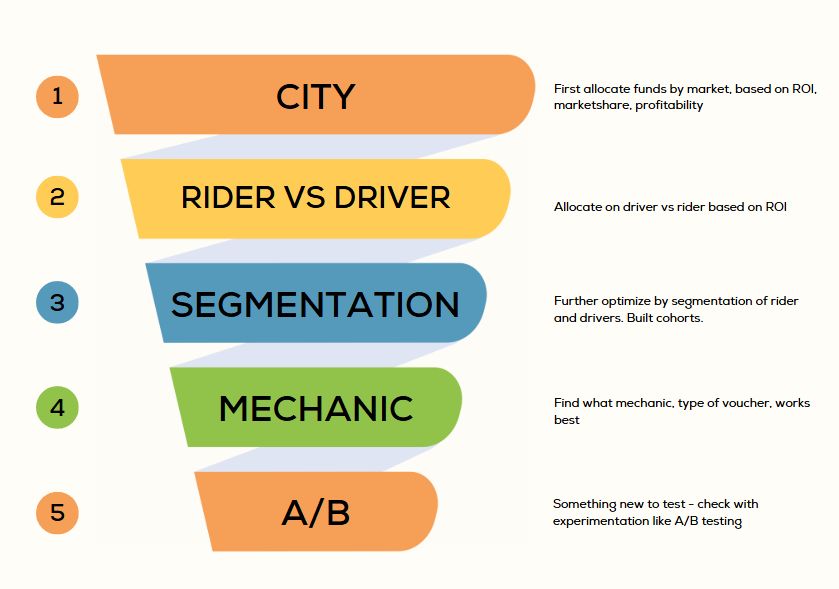
Five-stage funnel: city, rider vs driver, segmentation, mechanic, A/B test
Allocation cascade: city by ROI and profitability, then rider vs driver ROI split, then segment, mechanic and A/B test

Peak-hour problem

  • 24-hour and weekday-by-hour curves of demand, riders seeing zero cars, and active drivers
  • Separated undersupplied peaks from an oversupplied midday pool that can be shifted

Allocation model

  • Rank markets by incentive ROI (incremental GMV ÷ spend)
  • Fund profitable high-ROI markets first, then the best loss-making markets to reach 30 to 40% share
  • Split each city's budget between riders and drivers in proportion to their ROI

Operating model

  • Central growth analytics team, a finance business partner and heads of market, each with a clear role
  • Review cadence: red KPIs studied ahead of the call, actions logged, owners and ETAs tracked

Leadership signal

Went from one city's hourly curve to a governance design for 500 cities, and stated the limits plainly: geography, organic cannibalisation, and when the linear model stops holding.

The allocation table uses illustrative data to demonstrate the method.

Independent learning / interview case exercise. Based on publicly available data or an interview problem. Not professional work performed as an employee of any company. Figures and recommendations describe this exercise, not an employer implementation.

Case C · Evaluation design & payment analytics04 / Public-sector payments
Provincial health paymentsSide projectScale or not?

Should a new physician payment model be scaled?

4,000 family physicians moved from fee-for-service to a longitudinal payment model and saw 30 to 40% higher pay. Media coverage was positive. Before extending it, how do we prove it works for physicians, patients and the system's finances?

3audiences with their own success definition: physicians, residents, and overall health economics
2evaluation methods: matched 4,000 vs 4,000 cohort (preferred) and before/after on switchers
7–9 wkplan from KPI alignment to peer-reviewed recommendation
1 · Define successAgree KPIs and weights with all parties first. 2 weeks
→
2 · Gather and test dataEMR logs, surveys, payments, census. 2 to 3 weeks
→
3 · Comparative studyDeltas, significance and a weighted model score. 2 weeks
→
4 · Peer reviewPublish, challenge, iterate, then recommend. 1 to 2 weeks

Physician KPIs

  • Administrative hours
  • Attrition rate
  • New registrations in underserved areas
  • Compensation change and physician NPS

Resident KPIs

  • Wait time to see a doctor
  • Doctors accepting new patients
  • Patient NPS
  • Healthcare spend per resident and coverage

Risks named up front

  • Other reforms running at the same time
  • Unbalanced samples and non-uniform systems
  • The open question: would a plain 30 to 40% fee raise do the same?

Leadership signal

Designed an evaluation plan to test whether expansion would be defensible, with a separate study needed before applying findings to specialists.

Scorecard figures are illustrative, to demonstrate the method.

Independent learning / interview case exercise. Based on publicly available data or an interview problem. Not professional work performed as an employee of any company. Figures and recommendations describe this exercise, not an employer implementation.

Case D · Applied AI in regulated onboarding05 / Retail bank
Banking · KYCSide projectApplied computer visionBanco Daycoval

Bringing selfie identity checks in-house

The bank relied on a third-party service to verify new customers by selfie during web and mobile account opening. Could an in-house model match it and keep sensitive customer data under the bank's own control?

95%case-study matching benchmark; not a production deployment result
~10knew accounts opened each month
36k+potential work hours saved a year
InputsSelfie, identity document and the data the customer typed in
→
Face matchSiamese network compares the selfie with the document photo
→
Text matchOpenCV contour detection and Tesseract OCR read name, date of birth, ID number and address
→
VerifyImage and text comparisons together confirm the applicant's identity

Problem

Vendor dependence on the most sensitive data the bank holds, at the front door of every new account.

Approach

Two independent checks on every application: the face against the document, and the typed data against the document.

Business case

Proposed value: matching performance near the case-study benchmark, greater data control and potential annual time savings.

Leadership signal

Framed an ML build as a risk and cost decision that a bank's leadership could approve.

Independent learning / interview case exercise. Based on publicly available data or an interview problem. Not professional work performed as an employee of any company. Figures and recommendations describe this exercise, not an employer implementation.

Case E · Process automation06 / Global grocery retailer
Retail · CPGSide projectAI quality assuranceCarrefour

From hours of manual checks to a ten-minute QA

The retailer brings over 2,000 consumer packaged goods to market each year. Checking that the product data printed on each package is correct took a multi-stage manual process of hours or days per product, per iteration.

2,000+new packaged products a year in scope
2h+ → 10mbaseline versus proposed AI QA time per product in the scenario
90%+estimated QA time saving in the scenario

Problem

A slow, multi-stage manual gate repeated for every product and every packaging iteration.

Approach

Replace the manual review with an automated, AI-driven QA process for packaging data.

Modelled benefit

A proposed reduction to about ten minutes from two hours or more per product: an estimated saving of over 90%, subject to validation.

Leadership signal

Picked a process where time saved compounds across thousands of launches a year.

Independent learning / interview case exercise. Based on publicly available data or an interview problem. Not professional work performed as an employee of any company. Figures and recommendations describe this exercise, not an employer implementation.

Case F · Growth strategy & market entry07 / Rare-spirits e-commerce
E-commerce · EuropeSide projectRaró

Where a niche e-commerce brand should grow next

Against seven major competitors, the brand trailed the top five on assortment size, review-based quality and online traffic. Which markets should it enter, online and offline, and which should it avoid?
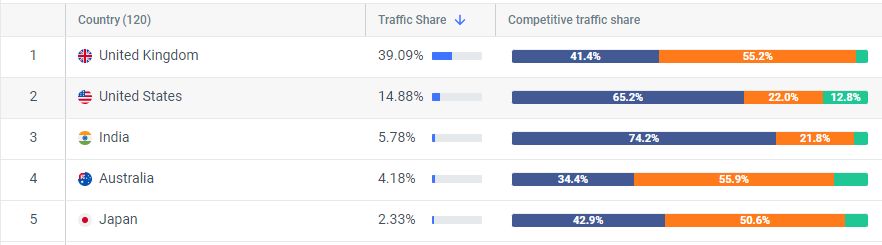
~40%of the top three competitors' web traffic comes from the UK
~62%of the leading French competitor's web traffic comes from France
4.4★brand rating on Trustpilot versus 4.8 to 4.9 for the top two rivals: quality is there, authority is not
Competitor web traffic share by country: United Kingdom first, United States second, then India, Australia, Japan
Competitor traffic by country (SimilarWeb), used to size where demand already exists
Market screen
MarketPer-capita whiskyE-commerce rank
France2.15 L7th
UK1.25 L4th
US (reference)1.41 L

Online

  • Enter UK (outside the EU) and France (inside the EU) with digital marketing
  • Content and keyword strategy, niche influencers, social channels
  • Look-alike personas built from existing customers

Offline

  • Partner with premium grocery chains such as Eataly (about 45 stores in 15 countries)
  • Premium hotels, tasting events and high-end whisky bars

Avoid for now

APAC, US and MENA: mature, crowded, capital-heavy, and complex to license for alcohol sale and delivery.

Leadership signal

Prepared an executive-style recommendation on where to expand and where to hold back, supported by public market evidence.

Independent learning / interview case exercise. Based on publicly available data or an interview problem. Not professional work performed as an employee of any company. Figures and recommendations describe this exercise, not an employer implementation.

An operating model for the marketplace case

08 / Operating model
Central analytics

One model, one set of KPIs

A lean central team owns targets and allocation models, carries learnings from one market into the next, and keeps measurement uniform so no market grades its own work.

Finance partner

Plans that reach the P&L

A finance business partner turns the recommended allocation into the business plan, updates targets and moves funds within the legal and regulatory framework.

Market leads

Ground truth flows back

Heads of market bring competitor moves and local constraints back into the model, and run their own reviews against the same targets.

BeforeRed KPIs studiedOwners prepare an action plan ahead of the call
In the roomDecide, don't narrateGlobal finance and market heads align on actions
AfterActions cascadedLogged with an owner and a date
Next reviewStatus firstOr sooner, at the agreed ETA
Over timeDid it move the metric?Actions are judged by the KPI, not by completion

Weekly, bi-weekly or monthly depending on how fast the market moves. Tooling: leadership dashboard, drill-down operational dashboards, an action log and an analytical stack for ad hoc deep dives.

Contact

Have a case or an idea to discuss?

I enjoy exploring new analytical problems and comparing approaches. For my professional experience and background, visit Home.

[email protected]